Circular cities operate on a closed-loop network to create a more sustainable economy.
THE PURPOSE
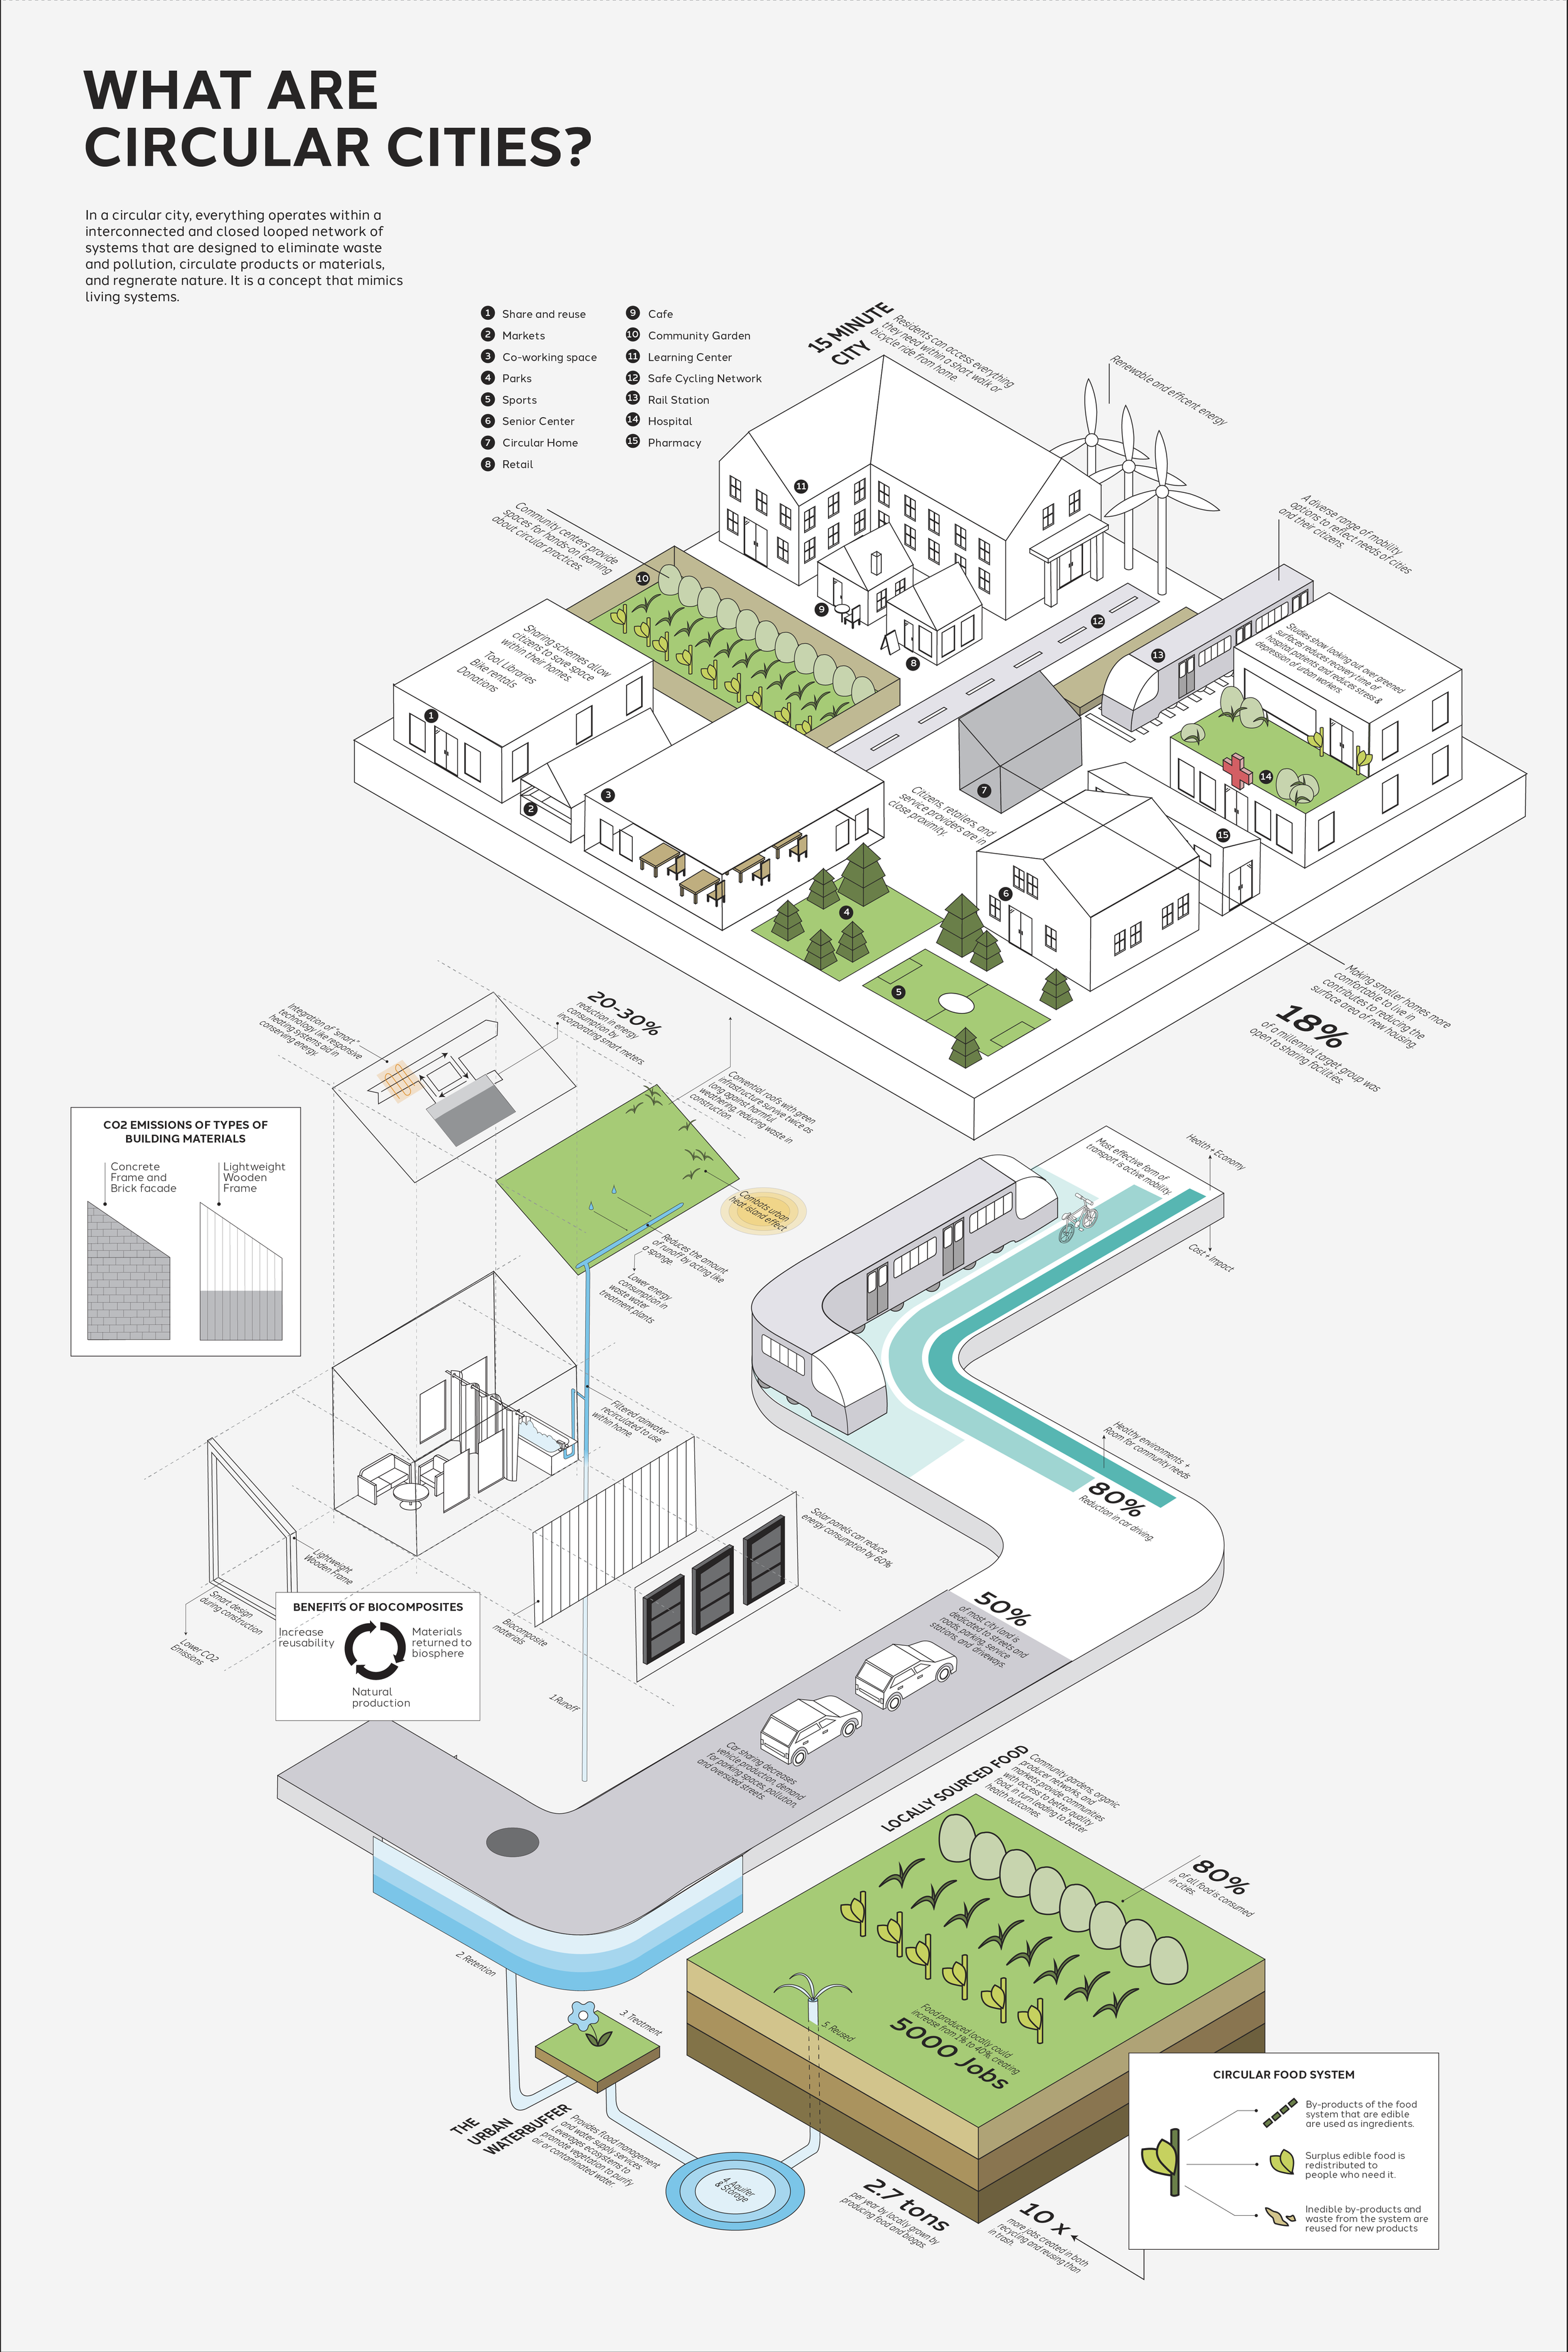
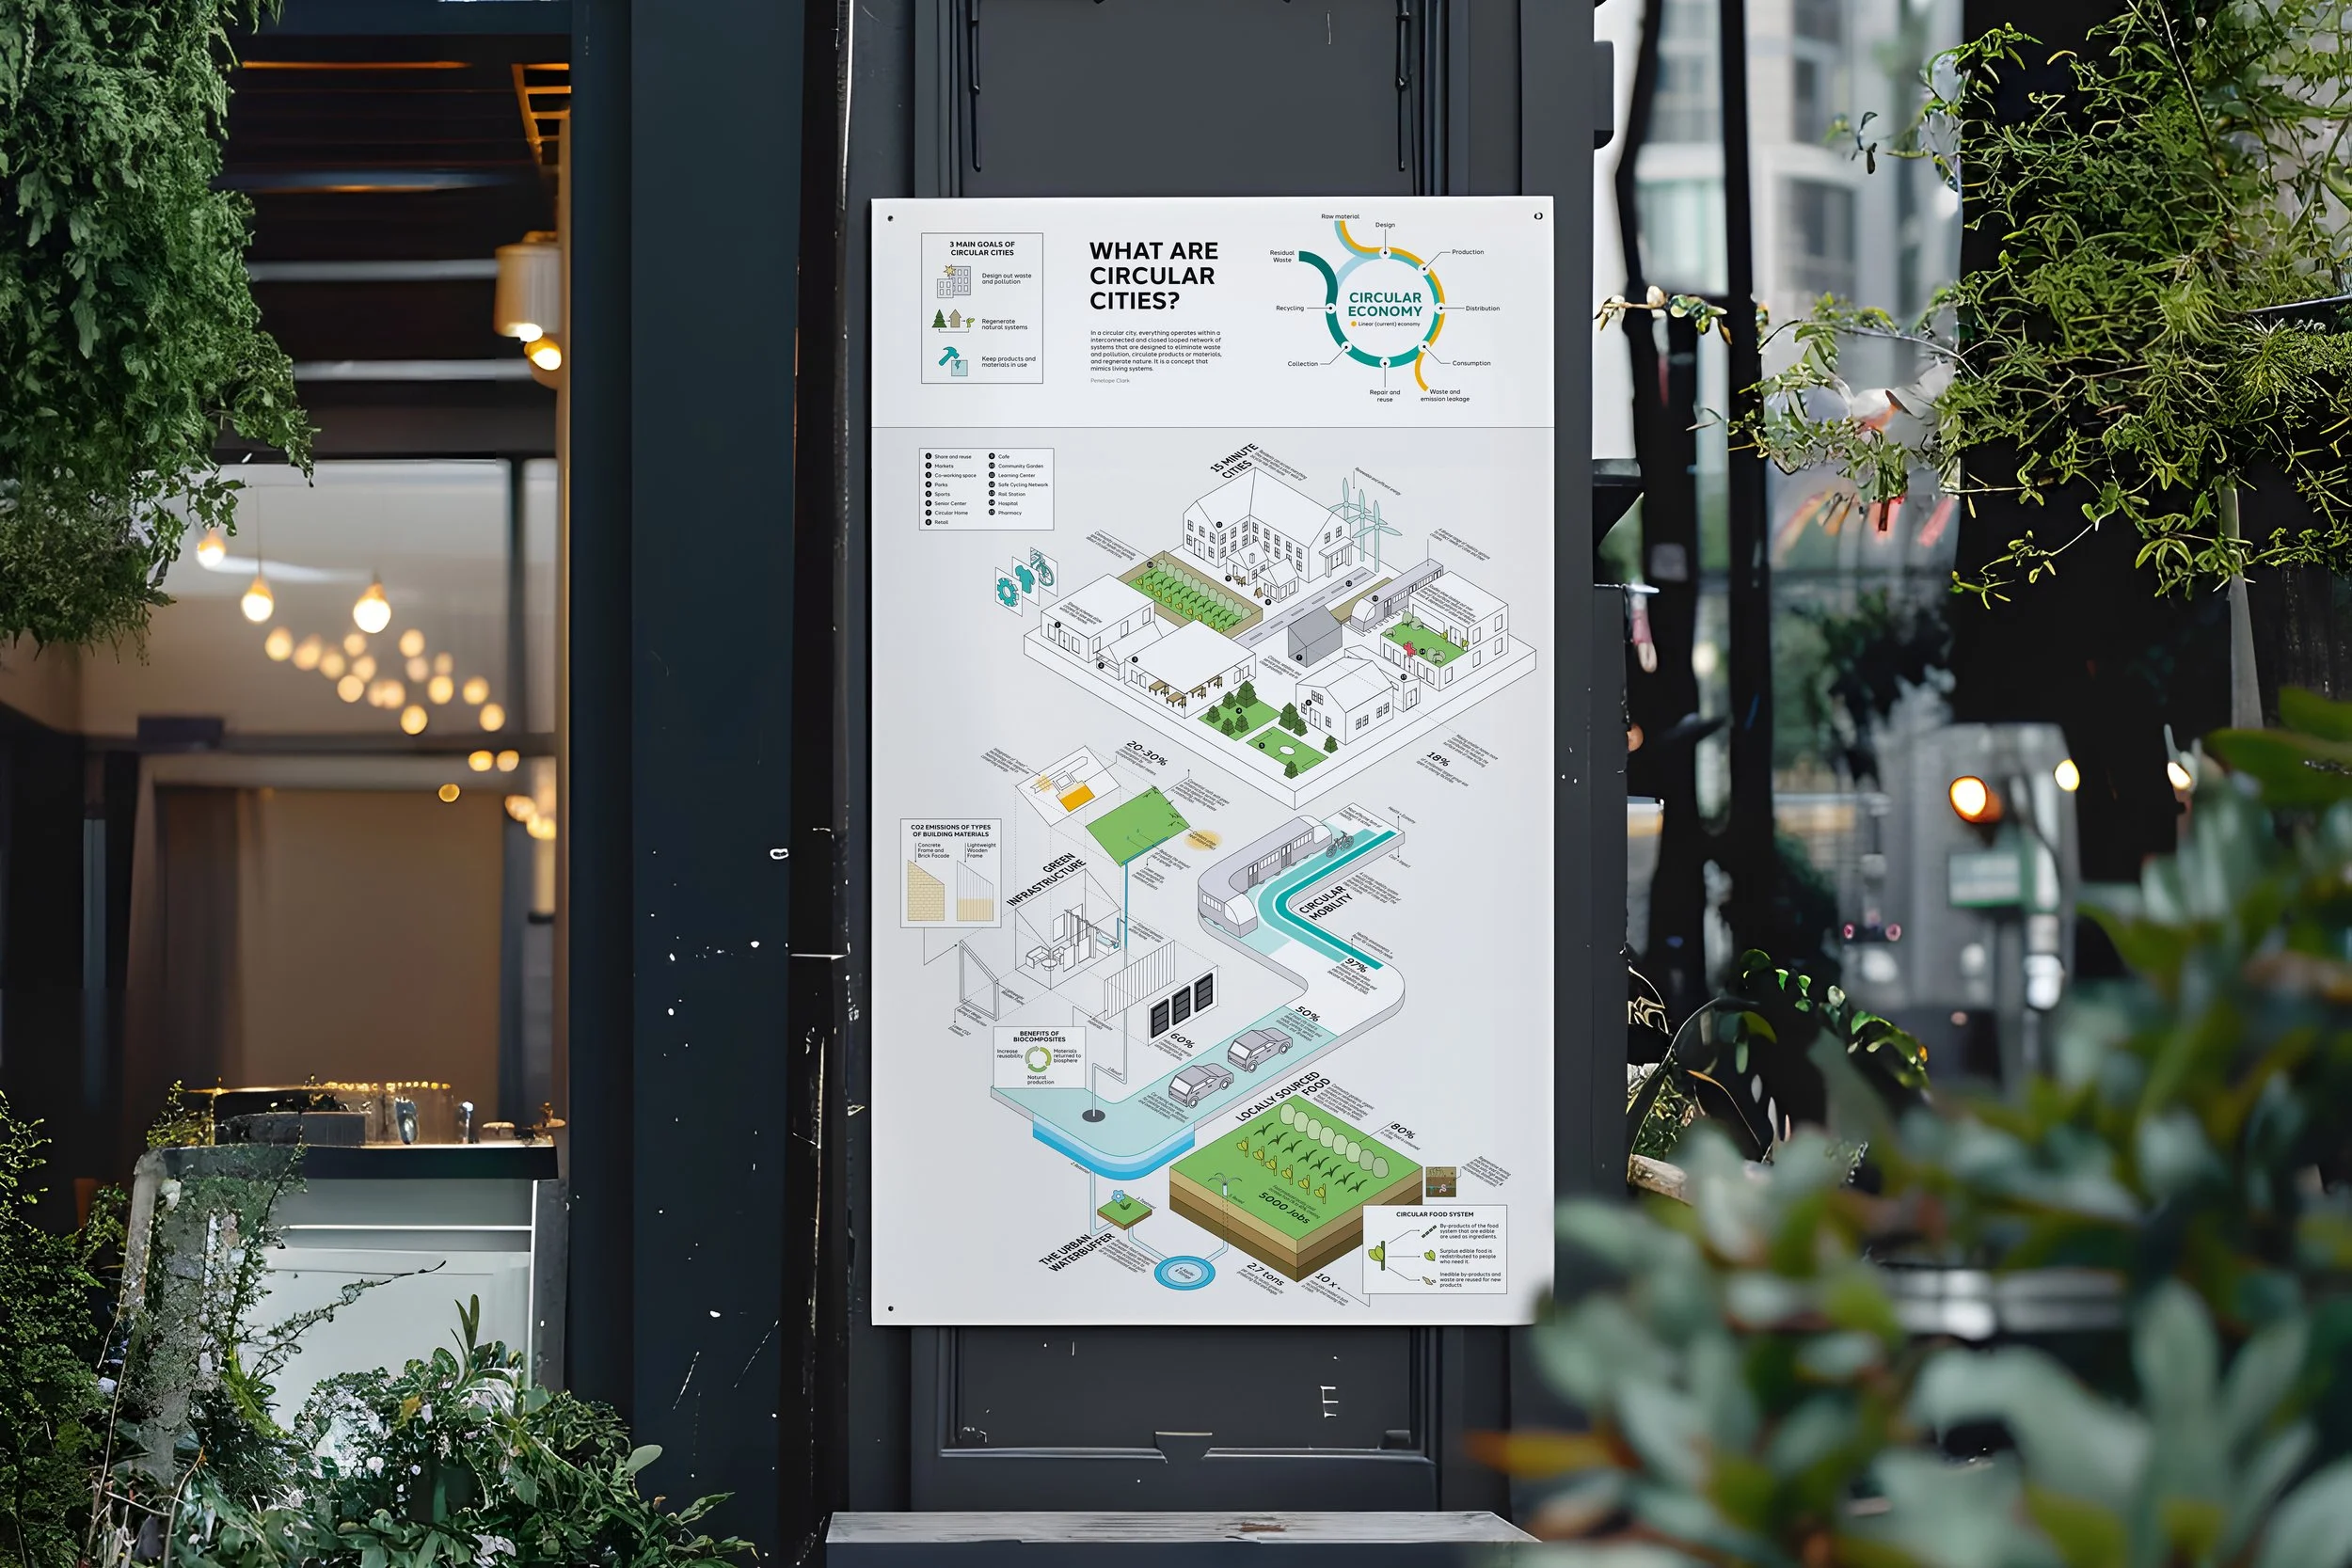
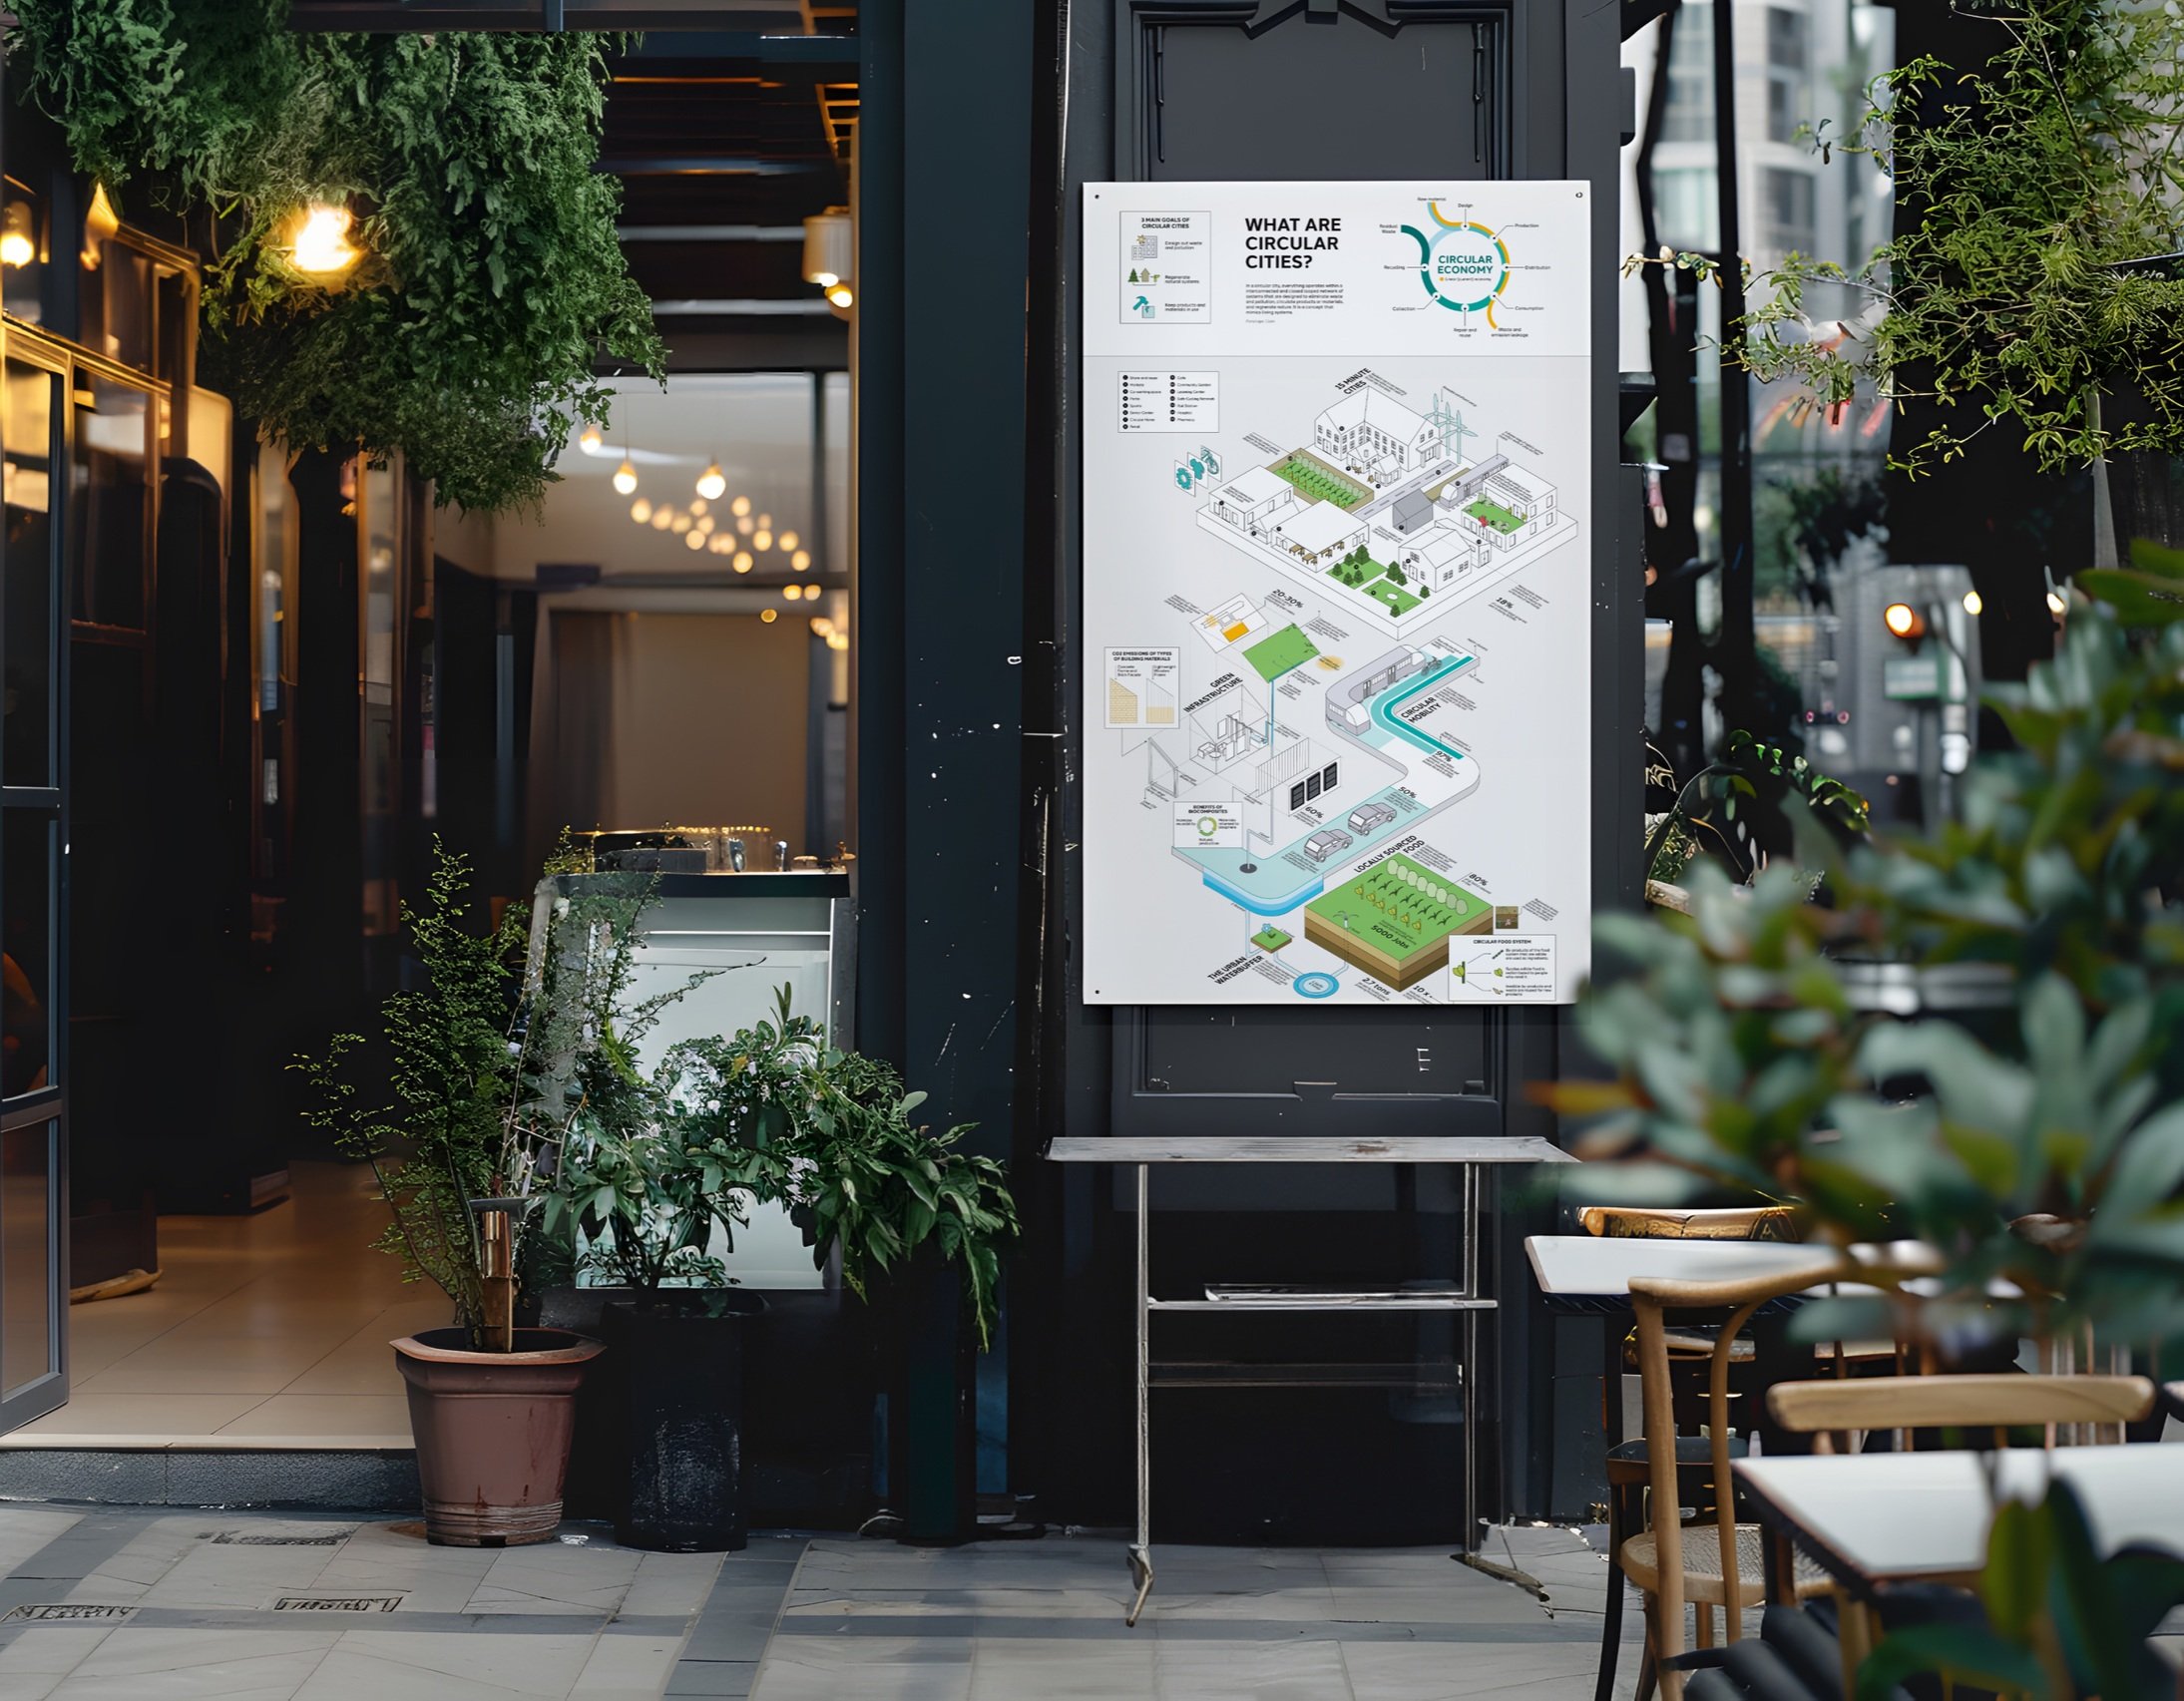
Circular Cities aim to eliminate waste, and pollution, circulate products, regenerate nature, and create a more sustainable environment overall, which is a concept that many cities today are beginning to adopt. The purpose of this infographic is to inform and persuade the reader about what circular cities are and why they are beneficial.
Conducted extensive research into the concept of circular cities and its meaning to understand the topic better. I decided to organize this research in a few ways to better understand how to frame my hierarchy for the infographic.
Decided to organize this research in a few ways to better understand how to frame my hierarchy for the infographic.
1. The overarching concept
2. Statistics
3. Monitoring and managing material flows - waste, jobs, money
4. Ecological factors - human relations, food, eco-terrace, building
5. Behavioral factors - shared spaces, mobility, community engagement, mentality
RESEARCH
MIND MAP
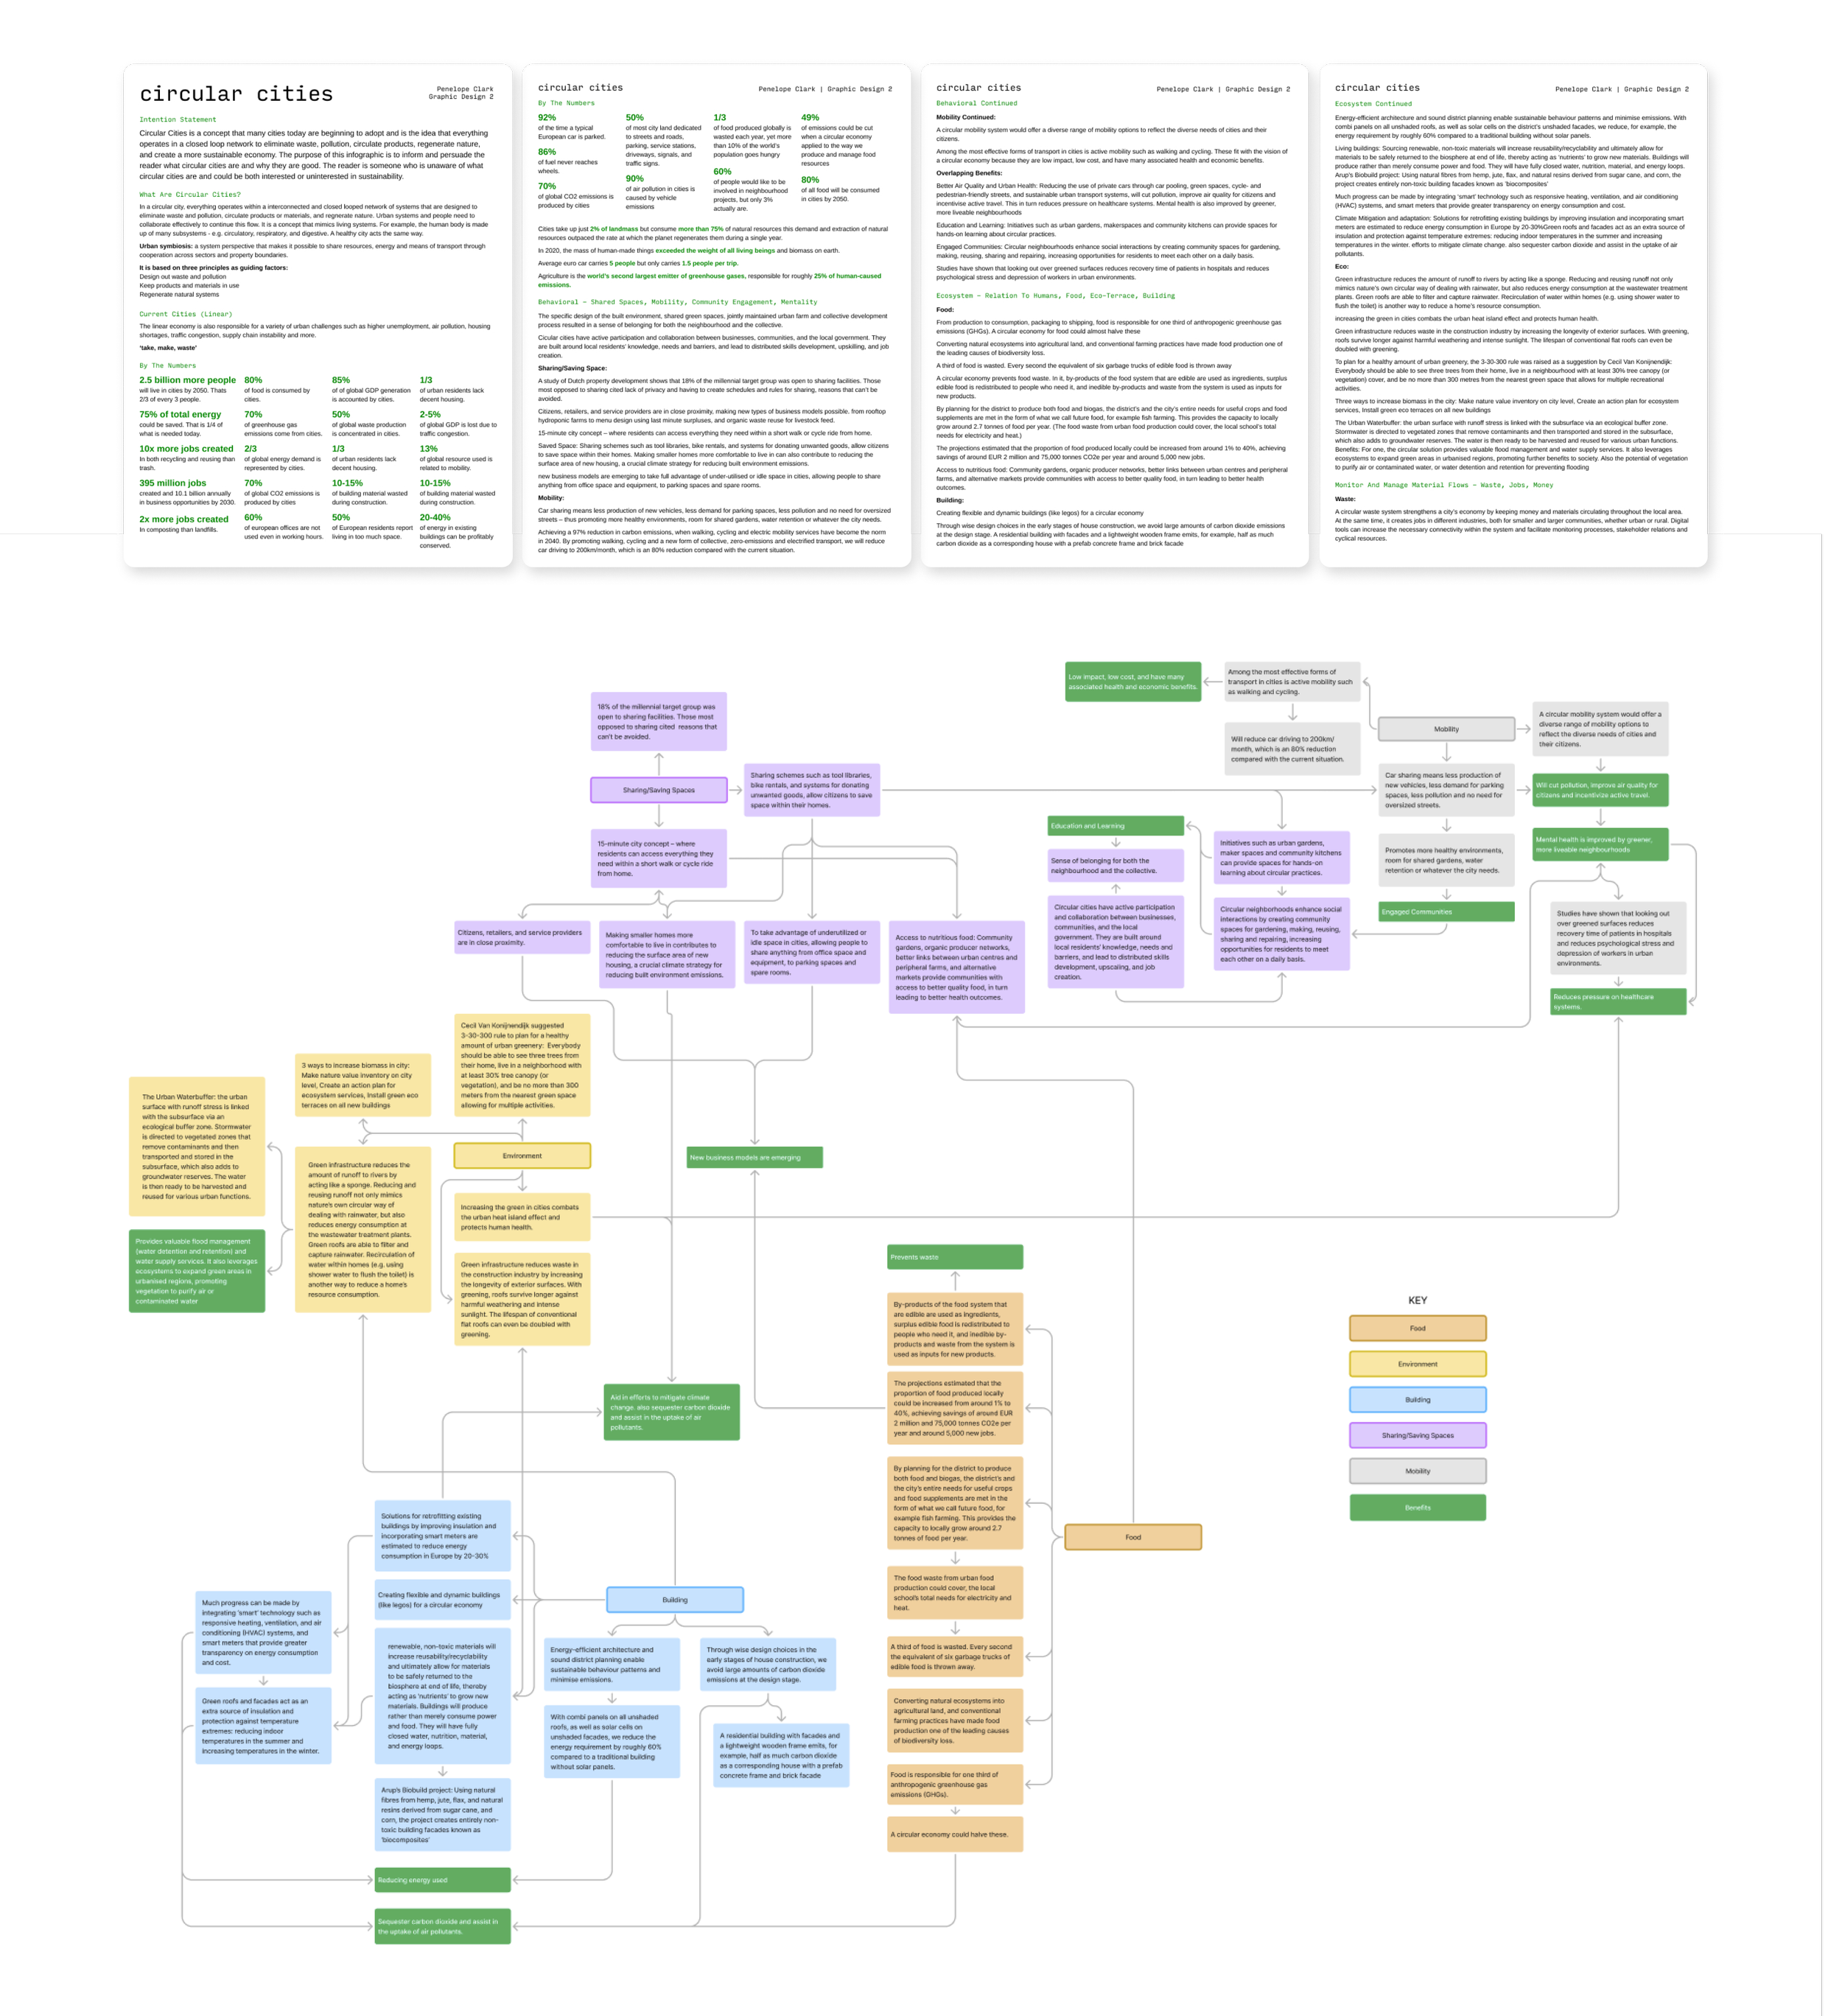
I further organized with a mind map so that I could better understand the topic as a visual learner.
This was organized even more simply, creating categories for:
Food
Environment
Building
Sharing/Saving Space
Mobility
And highlighting overlapping benefits
SKETCHES

Generated various ideas, focusing on the type of grid structure that would work best.
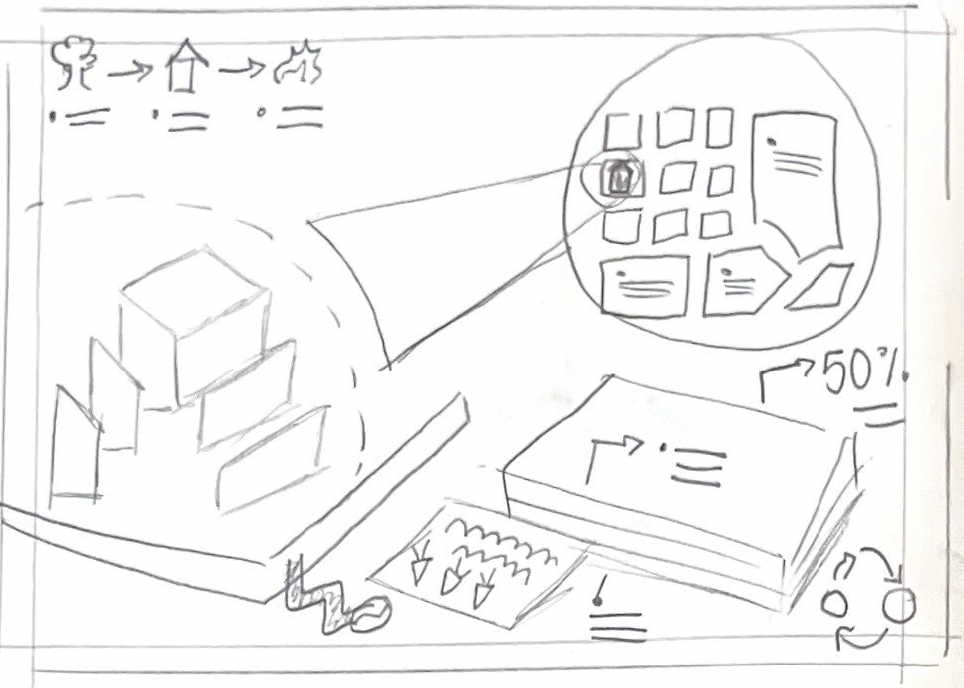
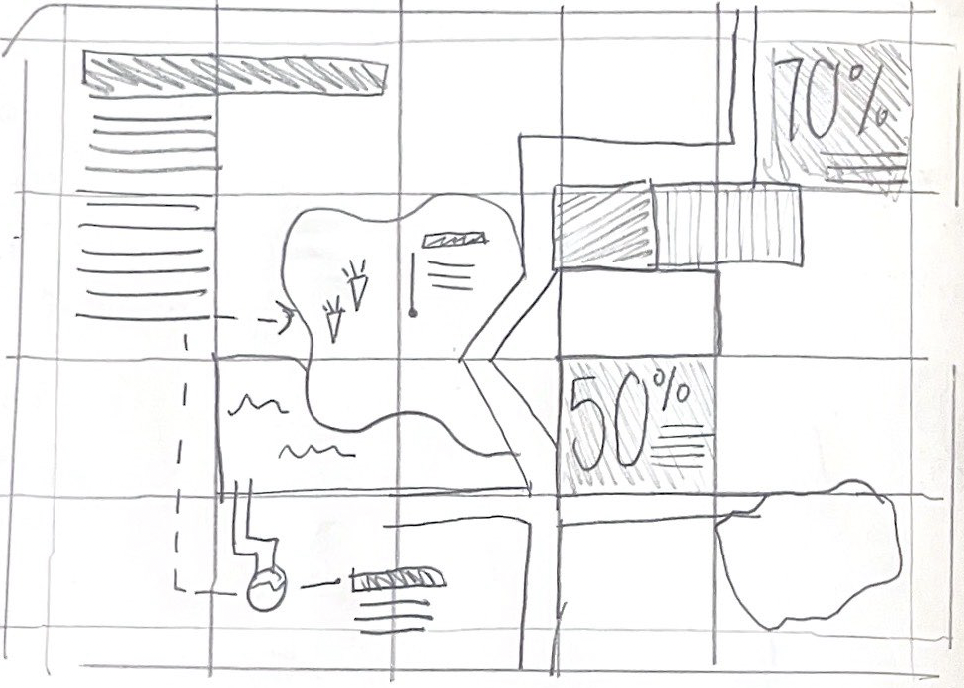
TURNING DATA VISUAL
Generated various ideas, focusing on the type of grid structure that would work best.
GRID ORGANIZATION
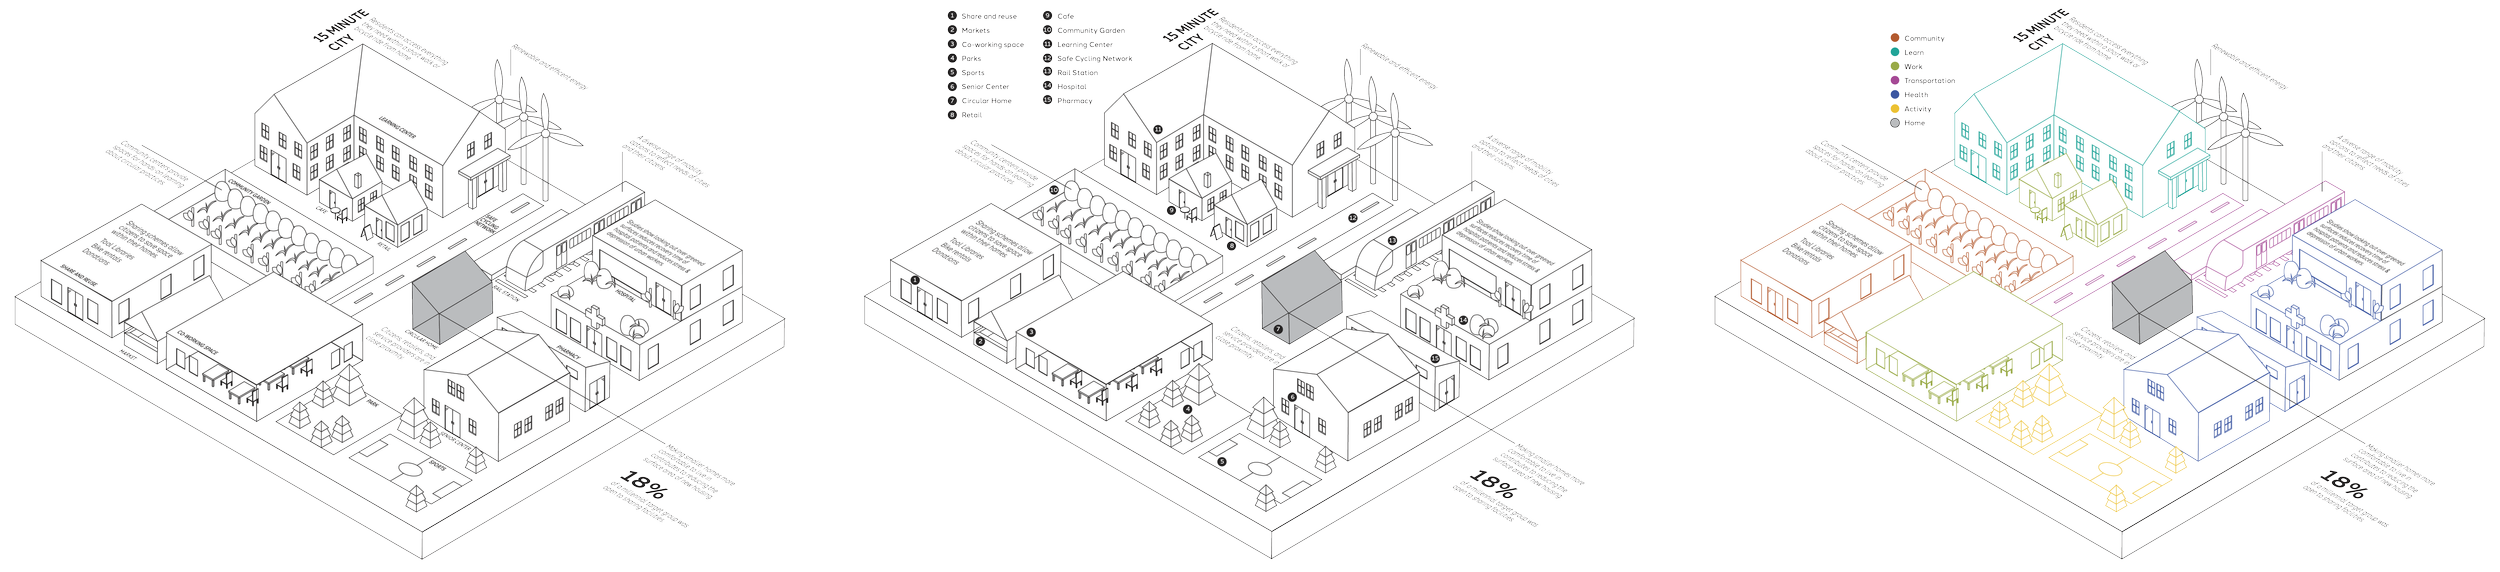
Using an isometric grid, I iterated ways to organize visual cues within sections of the poster and drew everything at an isometric angle to communicate the idea that this is a layout or blue-print for what a perfect circular city may look like.